Newsletter Subscribe
Enter your email address below and subscribe to our newsletter

Enter your email address below and subscribe to our newsletter
All voices matter
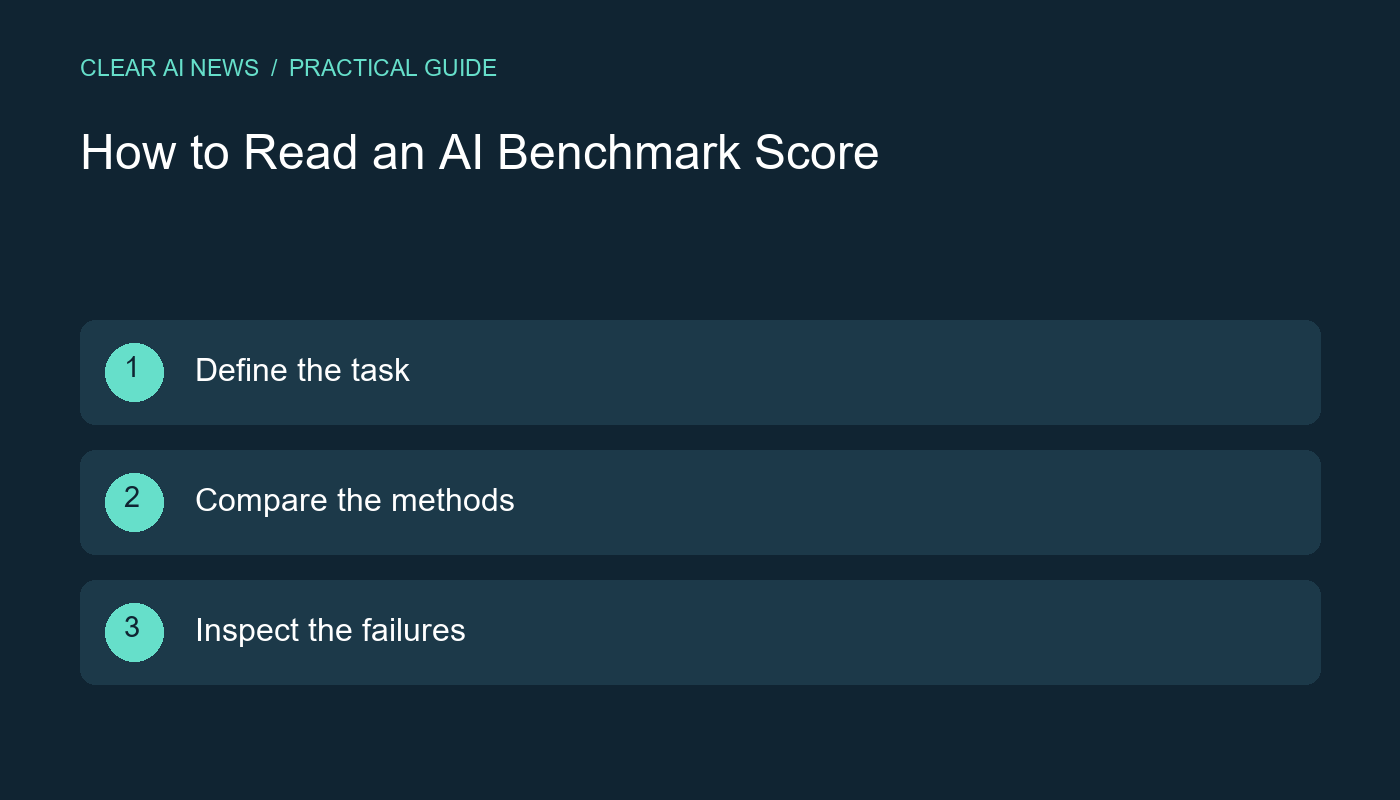
Learn what an AI benchmark score can and cannot tell you, including task definitions, baselines, error types and meaningful comparisons.
A benchmark score is the result of a particular evaluation. Before using it to choose an AI system, identify what was tested, how the score was calculated and which conditions were held constant. A large number without that context can be less useful than a modest result accompanied by a clear method. This guide gives you a way to read a benchmark table and turn it into questions for your own evaluation.
Start by describing what success means. Classifying a message as spam is different from answering a factual question, producing working code or retrieving the right document. Even tasks with similar names may use different input lengths, languages or permitted resources. Write down the input, expected output and scoring rule before comparing systems.
Imagine an assistant evaluated on short questions with a single reference answer. Your task may involve a long policy document and an explanation with quotations. The published test can still be informative, but it leaves your document-handling and citation requirements untested.
Ask what each number counts. In classification, accuracy measures the share of correct predictions, while precision and recall answer different questions about positive predictions and missed positives. The scikit-learn metrics documentation explains these definitions and their averaging options. A score labeled simply performance leaves too much unspecified.
Here is an invented arithmetic example, not a product result. Suppose a set contains ninety routine messages and ten urgent ones. A system labeling every message routine has ninety percent accuracy and misses every urgent message. If urgent cases are what matter, that accuracy is a poor basis for choosing the system.
Look for the same dataset version, scoring method and evaluation conditions. Did both systems receive the same instructions? Could one use external tools while the other could not? Were results generated in a single attempt or selected from several attempts? A difference in the setup may explain part of the gap.
Also check the baseline. Beating a weak or outdated baseline answers a narrower question than beating a well-configured alternative. When the method is unclear, record that uncertainty rather than assuming that two rows in the same chart are directly comparable.
A single average hides which examples were difficult. Ask for results by language, document type, input length or other categories that matter to your use case. If those breakdowns are absent, treat them as questions for a follow-up evaluation. Do not invent subgroup performance from an overall number.
Read some failed examples if they are available. A wrong date, an unsupported quotation and an awkward sentence may all count as failures under a scoring rule, but their consequences in your workflow differ. Decide which errors require a retry, a human check or rejection before looking at a candidate system's output.
Look for repeated runs, variation estimates and the number of evaluated examples. A tiny difference in a table does not by itself establish a dependable advantage. If the report omits uncertainty information, say that the available evidence does not establish how stable the difference is.
Avoid converting percentage points into relative improvement without explaining the calculation. Moving from seventy to seventy-five correct answers out of one hundred is a five-percentage-point increase. It does not mean the system is five times better, and it does not establish performance on a different population.
Create a small set of representative examples you are allowed to use. Include ordinary cases and cases likely to fail. Define the expected behavior before running the systems, keep the same instructions and record corrections as well as successful outputs. Preserve the inputs and relevant settings so the comparison can be repeated.
Your sheet should contain the example, expected result, observed result, error category and decision. Treat this as a practical screening exercise, not a statistically representative study unless your sampling and analysis justify that description. Our AI glossary can help with terms; our guide to checking AI news explains how to trace claims back to their sources.
Scikit-learn: metrics and scoring; AI glossary; How to follow AI news.
The tools, tutorials, and trends that actually pay — no hype.


The tools, tutorials, and trends that actually pay — no hype.